Click on any of the images below to enlarge them. These screen shots show only a few of the features available in ChartSmart.
Download Chartsmart now and if you have any questions feel free to email us at
info@chartsmart.com. If you have not done so yet please also check out our video tutorials.
 FILTER ARROW ALERTS -
Filter alerts can be displayed on daily charts. These are red and green arrows that correspond to when popular indicators take effect. On this chart the red vertical line shows where the MACD line crossed the signal line at the bottom of the chart. When you click on the arrow, information on the indicator is shown in a box on the lower left. Filter alerts are not meant as recommendations. They are guidelines to bring to your attention when important changes may be occuring in the momentum of the stock price and volume.
FILTER ARROW ALERTS -
Filter alerts can be displayed on daily charts. These are red and green arrows that correspond to when popular indicators take effect. On this chart the red vertical line shows where the MACD line crossed the signal line at the bottom of the chart. When you click on the arrow, information on the indicator is shown in a box on the lower left. Filter alerts are not meant as recommendations. They are guidelines to bring to your attention when important changes may be occuring in the momentum of the stock price and volume.
|
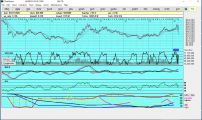 UP TO 4 INDICATOR BARS -
ChartSmart allows you to place up to 3 tiers of indicator bars under a chart plus you can use the volume scale as an additional tier. With 4 bars this gives ample room to display all your indicators. When you click anywhere on the chart, as in the example on the right, a red hairline will appear and a grey box is displayed on the upper left with data on all the indicators that you are using, including the fundamentals for the specific day you have clicked on the chart. You can click anywhere on the chart and get this complete information.
UP TO 4 INDICATOR BARS -
ChartSmart allows you to place up to 3 tiers of indicator bars under a chart plus you can use the volume scale as an additional tier. With 4 bars this gives ample room to display all your indicators. When you click anywhere on the chart, as in the example on the right, a red hairline will appear and a grey box is displayed on the upper left with data on all the indicators that you are using, including the fundamentals for the specific day you have clicked on the chart. You can click anywhere on the chart and get this complete information.
|
 INFORMATION BARS -
On the top of the chart on the right there are 2 bands which each can display up to 5 items. You can customize the information on the bands by clicking on [Display] then on [Information Bars] to display the menu as shown in the screenshot on the right. You can scroll down the left list or right list depending on the bar you are customizing. This way you can put the information pertinent to you on the chart. For example you may want to view the book value per share or the percent of institutions having invested in the displayed company.
INFORMATION BARS -
On the top of the chart on the right there are 2 bands which each can display up to 5 items. You can customize the information on the bands by clicking on [Display] then on [Information Bars] to display the menu as shown in the screenshot on the right. You can scroll down the left list or right list depending on the bar you are customizing. This way you can put the information pertinent to you on the chart. For example you may want to view the book value per share or the percent of institutions having invested in the displayed company.
|
 WEB PAGE LINKS -
If you go to [Tools] you can then select the menu to call up the web page for the displayed chart. If you are on line simply click on this option to call up the web page for the company. This enables you to access a wealth of information pertaining to the company without having to do any other searches to determine the web page for the company.
WEB PAGE LINKS -
If you go to [Tools] you can then select the menu to call up the web page for the displayed chart. If you are on line simply click on this option to call up the web page for the company. This enables you to access a wealth of information pertaining to the company without having to do any other searches to determine the web page for the company.
|
 DETAILED SECTOR SCREENING -
ChartSmart allows you to do some very detailed sector screening. In the screen on the right you can see the type of screening that is possible. Actually, there are over 200 categories in which companies are classified so that you can do detailed searches on companies in various industries and sectors. This data is updated regularly.
DETAILED SECTOR SCREENING -
ChartSmart allows you to do some very detailed sector screening. In the screen on the right you can see the type of screening that is possible. Actually, there are over 200 categories in which companies are classified so that you can do detailed searches on companies in various industries and sectors. This data is updated regularly.
|
 FUNDAMENTALS SCREENING -
In the filter menu there are now literally hundreds of fundamental screens available. The screen shot on the right shows a few of them. These include balance sheet items such as inventories, assets, liabilities, equity, debt and so on. In addition there are many ratios and important figures like book value and pe ratios. Other examples are number of employees in the company and % of institutional ownership. For example, select companies with constant dividend and earnings growth over the last 3 years. There are 1000's of screening options which can be combined with your technical screens.
FUNDAMENTALS SCREENING -
In the filter menu there are now literally hundreds of fundamental screens available. The screen shot on the right shows a few of them. These include balance sheet items such as inventories, assets, liabilities, equity, debt and so on. In addition there are many ratios and important figures like book value and pe ratios. Other examples are number of employees in the company and % of institutional ownership. For example, select companies with constant dividend and earnings growth over the last 3 years. There are 1000's of screening options which can be combined with your technical screens.
|
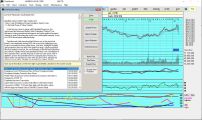 DISPLAY NEWS RELEASES -
A unique feature in ChartSmart is that when you display a chart, you can also display news bars right above the volume scale corresponding to the day of the news release. You can also color code the bars. For example, if you can set the bars to display in red for news releases that have the phrase [private placement] in the headline (or anything you choose). This allows you to immediately see when an important release occurs. You can also click on SMRY to display all the releases and you can even screen for keywords in the headlines and news releases.
DISPLAY NEWS RELEASES -
A unique feature in ChartSmart is that when you display a chart, you can also display news bars right above the volume scale corresponding to the day of the news release. You can also color code the bars. For example, if you can set the bars to display in red for news releases that have the phrase [private placement] in the headline (or anything you choose). This allows you to immediately see when an important release occurs. You can also click on SMRY to display all the releases and you can even screen for keywords in the headlines and news releases.
|
 UNLIMITED PORTFOLIOS -
ChartSmart allows you to create an unlimited number of portfolios. The simple portfolio manager allows you to enter the number of shares you own of specific securities then your portfolio is updated automatically when you do a data update. Each portfolio allows you to get a total summary for the day of the total value and individual profit and loss for each security. It even shows the change in the value of your portfolio from the previous day.
UNLIMITED PORTFOLIOS -
ChartSmart allows you to create an unlimited number of portfolios. The simple portfolio manager allows you to enter the number of shares you own of specific securities then your portfolio is updated automatically when you do a data update. Each portfolio allows you to get a total summary for the day of the total value and individual profit and loss for each security. It even shows the change in the value of your portfolio from the previous day.
|
 MANY TECHNICAL SCREENS -
In almost all cases ChartSmart enables you to screen for any indicator that it offers. For example, you can turn on the Bollinger Bands and set screens so that the last price traded is at any location relative to the upper and lower Bollinger Band. Other popular screens include Relative Strength Values, OBV, ADX, Average True Range, Stochastics Values and one of the more popular ones, where the macd line crosses the signal line. These are only a few of the technicals you can screen on and the real feature is that you can combine them or screen with other screens such as fundamentals.
MANY TECHNICAL SCREENS -
In almost all cases ChartSmart enables you to screen for any indicator that it offers. For example, you can turn on the Bollinger Bands and set screens so that the last price traded is at any location relative to the upper and lower Bollinger Band. Other popular screens include Relative Strength Values, OBV, ADX, Average True Range, Stochastics Values and one of the more popular ones, where the macd line crosses the signal line. These are only a few of the technicals you can screen on and the real feature is that you can combine them or screen with other screens such as fundamentals.
|
 CUSTOMIZE SCREENING FORMULAS -
IN addition to offering a great number of possible screens, you can create your own formulas. This applies to technical and fundamental screens. You can basically take any screening variables we supply and draw relationships between them. For example, you could specify that this quarters revenue is at least 20% above the previous quarter. You can draw up complex formulas with many variables enabling you to enhance the screening capabilities of ChartSmart many times over. Our technicians are more that glad to assist you in creating custom formulas.
CUSTOMIZE SCREENING FORMULAS -
IN addition to offering a great number of possible screens, you can create your own formulas. This applies to technical and fundamental screens. You can basically take any screening variables we supply and draw relationships between them. For example, you could specify that this quarters revenue is at least 20% above the previous quarter. You can draw up complex formulas with many variables enabling you to enhance the screening capabilities of ChartSmart many times over. Our technicians are more that glad to assist you in creating custom formulas.
|
 SCREEN NEWS CONTENT -
In the filter menu you can go to a specific area under the [special] tab to screen on more complex items such as when stocks were listed, whether they have had stocks splits or reorganizations over a specific period of time, and you can screen the news releases. For example, if you were looking for all companies with the word [platinum] in their news release in the last 3 months ChartSmart would create this list then when you look at the charts, the news bar is extended so you can see which news release and when it occured.
SCREEN NEWS CONTENT -
In the filter menu you can go to a specific area under the [special] tab to screen on more complex items such as when stocks were listed, whether they have had stocks splits or reorganizations over a specific period of time, and you can screen the news releases. For example, if you were looking for all companies with the word [platinum] in their news release in the last 3 months ChartSmart would create this list then when you look at the charts, the news bar is extended so you can see which news release and when it occured.
|
 UNLIMITED WATCH LISTS -
Probably the most useful tool in ChartSmart is your watch lists. Basically, when you create a screen, it drops a group of stocks into a list, for example, maybe 200 stock symbols. Then you return to the Charting Menu and scroll through the stocks. Before you scroll you can create a watch list such as [Stocks to Short] and then as you scroll the charts you can quickly add the chart you are viewing to the watch list with the f3 key or clicking on [ZWTCH]. These lists are kept permanently for you to review at any time. You can even screen your watch lists for criteria you are interested in.
UNLIMITED WATCH LISTS -
Probably the most useful tool in ChartSmart is your watch lists. Basically, when you create a screen, it drops a group of stocks into a list, for example, maybe 200 stock symbols. Then you return to the Charting Menu and scroll through the stocks. Before you scroll you can create a watch list such as [Stocks to Short] and then as you scroll the charts you can quickly add the chart you are viewing to the watch list with the f3 key or clicking on [ZWTCH]. These lists are kept permanently for you to review at any time. You can even screen your watch lists for criteria you are interested in.
|
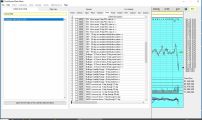
 EXPORTING OF QUOTE DATA -
Many of our users also use ChartSmart as a data tool. You can export both daily and historical data to various file formats such as ascii and xcel so that you can manipulate the data yourself or import it into other software packages. This way if you have ChartSmart, you do not need a separate data supplier if you also use another end-of-day charting tool in conjunction with ChartSmart. Exporting fields like open, high, low, close, and volume can be done easily on a daily basis and the format is very flexible as well.
EXPORTING OF QUOTE DATA -
Many of our users also use ChartSmart as a data tool. You can export both daily and historical data to various file formats such as ascii and xcel so that you can manipulate the data yourself or import it into other software packages. This way if you have ChartSmart, you do not need a separate data supplier if you also use another end-of-day charting tool in conjunction with ChartSmart. Exporting fields like open, high, low, close, and volume can be done easily on a daily basis and the format is very flexible as well.
|
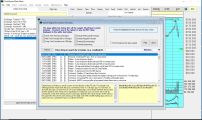 SEARCHABLE DATABASE of pre-made sample screens -
When you create your own formulas (click on CREATE FORMULA in YOU SPECIFY), you can now see a button on the bottom of the menu to search our database of stocks screening pre-made formulas. The formulas range from candlestick formulas, pattern screens like cup and handle, and other screens like long term declines over many years followed with breakouts. We welcome your suggestions and we will be continually building this searchable database for screens you might be interested in.
SEARCHABLE DATABASE of pre-made sample screens -
When you create your own formulas (click on CREATE FORMULA in YOU SPECIFY), you can now see a button on the bottom of the menu to search our database of stocks screening pre-made formulas. The formulas range from candlestick formulas, pattern screens like cup and handle, and other screens like long term declines over many years followed with breakouts. We welcome your suggestions and we will be continually building this searchable database for screens you might be interested in.
|
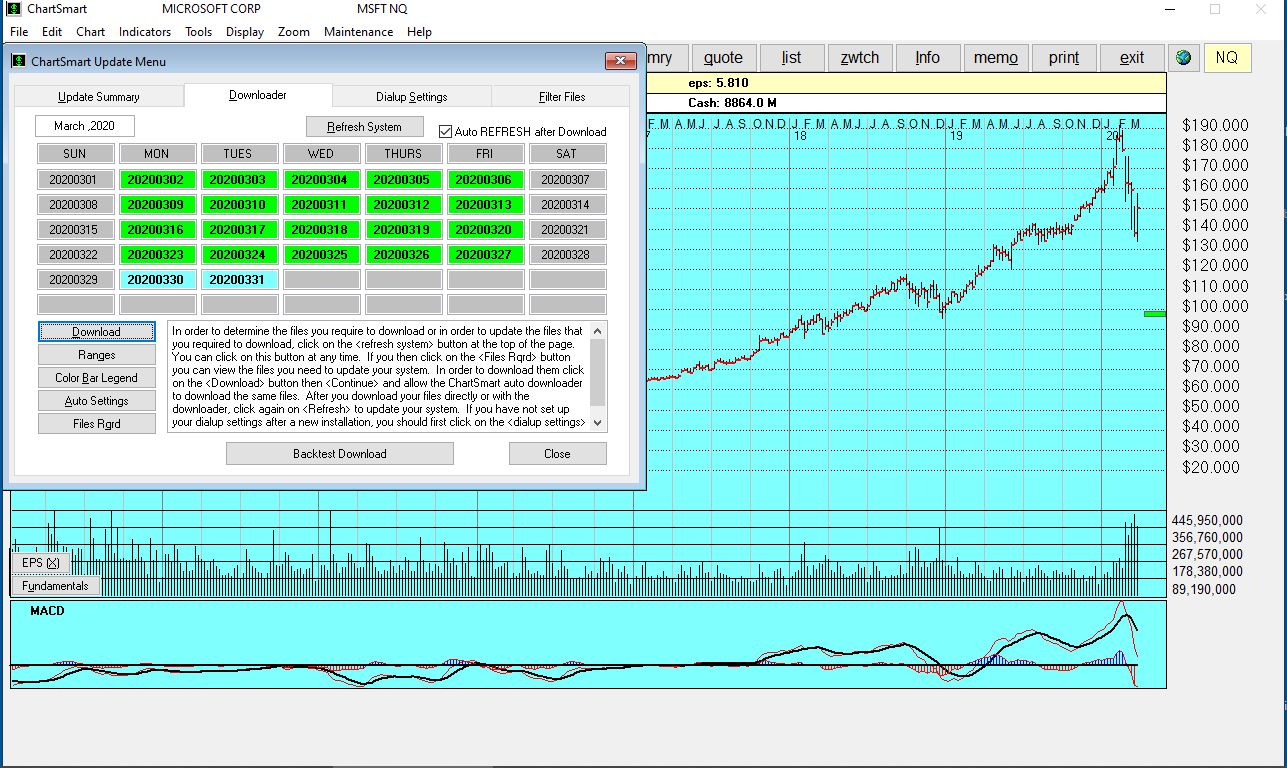
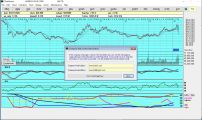
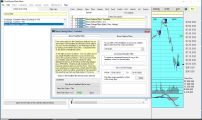
 DATA UPDATES ARE EASY (Auto click on REFRESH SYSTEM) -
With ChartSmart your daily update for all your screens, charts and portfolios takes only seconds. If you click on the right you will see the check box to automatically REFRESH SYSTEM after the download, a new feature in Version 4.00. Once on line, simply click DATA then download and the necessary files are downloaded in seconds. Then you click one other button to refresh. All updates are done automatically including splits, names changes, updates of fundamentals and so on.
DATA UPDATES ARE EASY (Auto click on REFRESH SYSTEM) -
With ChartSmart your daily update for all your screens, charts and portfolios takes only seconds. If you click on the right you will see the check box to automatically REFRESH SYSTEM after the download, a new feature in Version 4.00. Once on line, simply click DATA then download and the necessary files are downloaded in seconds. Then you click one other button to refresh. All updates are done automatically including splits, names changes, updates of fundamentals and so on.
|
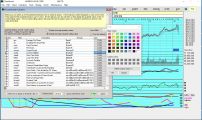
 PLOTTING FUNDAMENTALS -
One of the features in ChartSmart is the ability to plot fundamentals on the charts, not just technical indicators. You can plot up to 8 years of history for items like revenues, eps, pe, inventories, current assets, long term and short term debt, liabilities and many financial ratios. This is a unique and incredibly useful tool so that you can interpolate trends in these criteria. Being able to plot these items at the bottom of charts is ideal when used in conjunction with screens in the trends of these fundamental indicators. Click on the chart to the right and you can see the red EPS line showing eps growth in the last 2 years.
PLOTTING FUNDAMENTALS -
One of the features in ChartSmart is the ability to plot fundamentals on the charts, not just technical indicators. You can plot up to 8 years of history for items like revenues, eps, pe, inventories, current assets, long term and short term debt, liabilities and many financial ratios. This is a unique and incredibly useful tool so that you can interpolate trends in these criteria. Being able to plot these items at the bottom of charts is ideal when used in conjunction with screens in the trends of these fundamental indicators. Click on the chart to the right and you can see the red EPS line showing eps growth in the last 2 years.
|
 FUNDAMENTALS MENU -
On the screen to the right you can see the fundamentals menu. It is arrived at by clicking on [Indicators] then on [Fundamentals]. As you can see, there are a large selection of fundamentals you can plot on the weekly charts. You can plot up to 5 indicators on the bar as shown under the chart. You can also select to plot either the quarterly values or the trailing values over the last 4 quarters (12 months). You can adjust the color of the fundamental indicator lines as well as the width of the lines.
FUNDAMENTALS MENU -
On the screen to the right you can see the fundamentals menu. It is arrived at by clicking on [Indicators] then on [Fundamentals]. As you can see, there are a large selection of fundamentals you can plot on the weekly charts. You can plot up to 5 indicators on the bar as shown under the chart. You can also select to plot either the quarterly values or the trailing values over the last 4 quarters (12 months). You can adjust the color of the fundamental indicator lines as well as the width of the lines.
|
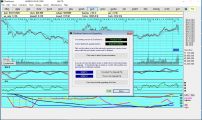 CHECKING ON YOUR CURRENT UPGRADE IS EASIER -
In order to determine if you have the latest ChartSmart upgrade simply go to HELP and ABOUT CHARTSMART. Check the Version and Build on the menu then click on CLICK HERE FOR LATEST VERSION INFORMATION. A screen will display with all the information about recent upgrades
CHECKING ON YOUR CURRENT UPGRADE IS EASIER -
In order to determine if you have the latest ChartSmart upgrade simply go to HELP and ABOUT CHARTSMART. Check the Version and Build on the menu then click on CLICK HERE FOR LATEST VERSION INFORMATION. A screen will display with all the information about recent upgrades
|