Stock Screening Software and Stock Charting Software

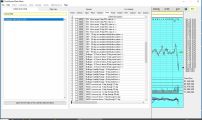
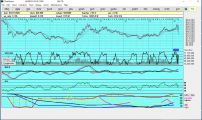
Few stock screeners can match the flexibility and speed of Chartsmart. Chartsmart is a premium end-of-day stock charting and stock screening tool that works on U.S. securities and Canadian securities. Used by professional stock researchers, stock brokers, and individual investors, it is capable of detailed stock screens unavailable in any other stock screeners. The entire program installs directly on your PC so screening through our database of over 14,000 Canadian and U.S. securities is incredibly fast. In addition you get the extra security, and privacy, of having your data on your computer, NOT on the internet. Daily end-of-day data updates are available at 4:30 Pacific time. Start your 30 day free trial now and download Chartsmart.
Use our preset screens, or create your own custom screens. Combine hundreds of fundamental and technical screening criteria. For example, screen out cash rich US and CDN securities that exhibit dividend growth and revenue. At the same time, specify that they are at year lows and breaking into uptrends. As an example with Canadian micro caps, screen out ones that have had recent consolidations, issuance of options, private placements, or that have cash and marketable securities exceeding their liabilities. Once your desired screen is created, scroll through the charts and save the ones you like into your personal watch lists. You can even create your own formulas for screens. For example, specify that your screen only selects stocks that have more cash per share than their current trading price. Easily combine fundamental screens with traditional technical screens such as moving average crossovers, bollinger bands breakouts, and MACD crossovers.
A) Watch this video on
screening dividends and EPS.
(7.0 minutes)
B) You can also watch our
detailed introductory video
(41.15 minutes).
C) Watch
this video
with stock screening examples (8.25 minutes).
D) View this recent 2020
review done on Chartsmart
by Warrior Trading.
As you scroll through charts that you have screened, you can quickly place them in your custom watch lists. Import your stock positions into our portfolio manager. Export data and symbols to popular formats. Even print your own chartbook of the stocks in your watch lists. Below we have printed to PDF's all the stocks in the dow30, 4 per page, back 8 years, with fundamentals on the bottom.
Click here to see how you can print pages with a stock chart and its fundamentals. Print all the stocks in your filtered list to pdfs thereby creating your own stock chartbook with Chartsmart! With 160 companies in your filtered list, you could print them with all your custom indicators, in the format that you select.
Here are some more features you will find in Chartsmart!
- Runs under all versions of Windows but not on a MAC Operating System. Can run on a MAC if you use Windows emulation software.
- Includes NYSE, NASDAQ, AMEX, TSX, TSX VENTURE, and CSE. In 2023 we added the CSE (Canadian Stock Exchange). This is a relatively new exchange with about 800 listed companies. All exchanges include 10 year price history charts, fundamental data which can be plotted on the charts, and news.
- Customize your own screening formulas by selecting from 100's of variables. You can even create your own custom candlestick screens
- Display stock bar charts or candlestick charts as arithmetic or semi-log.
- Screen any combination of 150 industry groups.
- Screen for stocks with stock splits/new listings and more. For Canadian Stocks screen out for when private placements and options to insiders are done.
- Plots fundamentals like revenue, cash, dividends, p/e, and eps right on the charts. This unique feature enables you to see the change in price on the chart relative to earnings and revenue growth.
- Create unlimited portfolios and watch lists.
- Filter Arrow Alerts - red sell signal arrows and green buy signal arrows when various indicators occur such as MACD crossovers.
- Export your end-of-day daily and historical stock data to popular file formats.
- Draw trendlines on 100 charts that you may be watching. Then run a screen on them to determine which ones have crossed the trendlines. Screening trendline breakouts is a feature found in no other software that we are aware of.
- We include prepared lists that you can screen. A few examples are US ETFS, CDN ETFS, or constituents of various Canadian INDEX groups and US INDEX groups. Screen stocks in these custom lists and then do further screens on them, customizing your screen to your needs.
- Once you have created your own custom lists of say 175 stocks that you are watching, you can use that list as a template on which to do other screens. For example you could specify the ones in your List that are near year lows. This might be 23 stocks which you can save in a new List.
- If you have multiple lists for example A with 240 stocks and B with 480 stocks, and list C with 111 stocks, combine them and create a list of only stocks common to them, or create a new list that contains stocks found in all the lists.
- Chartsmart has over 50 premade candlestick screens that you can apply. They are all a part of our custom formulas that we create and you can combine with other screening variables. The custom formula database is found when you go to the FILTER MENU, then to the YOU SPECIFY TAB. When you go to CREATE FORMULA at the bottom you will see our option to review the CHARTSMART CUSTOM FORMULA DATABASE at the bottom of the page.
- Some stock screeners will allow you to screen for RSI over 70, but how about over time? Chartsmart enables you to screen, not just on the value of an indicator, but also on its rate of change. For example, specify that the 14 day RSI is currently over 80 but 5 days ago it was under 50, and 10 days ago it was under 30. This feature uses our daily backtesting stock screening files and is another unique feature to Chartsmart.
- Create your own candlestick pattern screens. You could specify, for example, that todays high is within 5% of yesterdays low, and yesterdays close is no more than 20% from the low of the range between the high and low of the previous day.


